G-Band Water Vapor Radiometer (GVR)

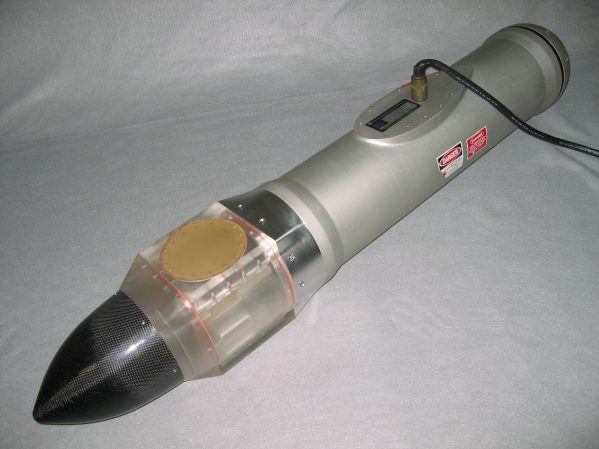
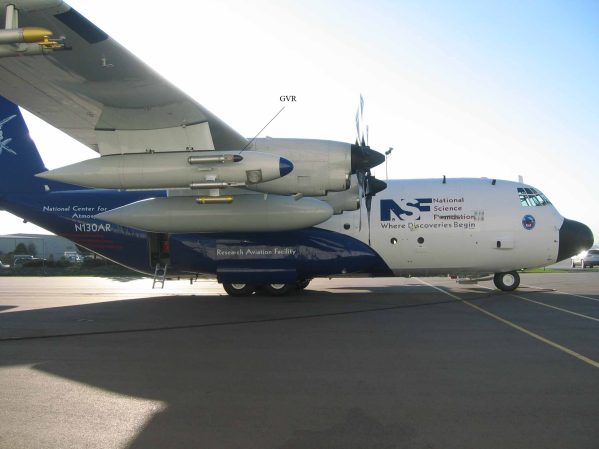
GVR estimates low concentrations of precipitable water vapor and liquid water path from brightness temperature measurements using four double-sideband receiver channels centered at 183.31 GHz +-1, +-3, +-7 and +-14 GHz. The instrument is packaged and wired to operate from a standard PMS probe canister.

A ground-based version of this instrument is also available for measurements in arid climate.


GVR Specifications
Frequency:   183.31 ±1, ±3, ±7 and ±14 GHz
Bandwidth:   0.5 (1), 1.0 (3), 1.4 (7) and 2.0 (14) GHz
Delta T:   ~1 K @ 200 ms integration (5 Hz data rate)
TRec:   1750 K (1), 1610 K (3), 1600 K (7) and 2170 K (14)
Data Rate:   0.1-20 Hz with periodic calibration
Antenna:   4″ offset reflector, 2 degree beamwidth
Radome:   Surface matched TPX window
Weight:   22 lb (38 lb with canister)
Power:   28 W AC, 126 W max. (~50 W ave.) 28 VDC
Example Data

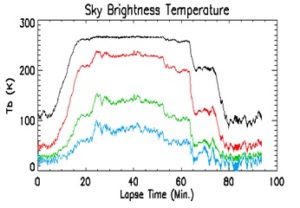
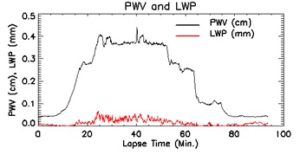
On October 26, 2006 the NRC Canada Convair aircraft descended into a liquid cloud for a 50 minute level flight leg, then ascended out of the cloud layer. The recorded zenith brightness temperature from the four receiver channels is shown in Figure 1 and the corresponding retreived Precipitable Water Vapor (PWV) and Liquid Water Path (LWP) are shown in Figure 2.

Convair_data_Tb

Figure 1: Data collected with the Airborne GVR during a CloudSat validation flight near Ottawa, Canada on October 26, 2006. Zenith brightness temperature data is shown from the four double sideband receiver channels: Black=183.31 GHz +-1 GHz, Red=+-3 GHz, Green=+-7 GHz and Blue=+-14 GHz.

Convair_data_PWV_LWP

Figure 2: Precipitable Water Vapor (PWV) and Liquid Water Path (LWP) estimated using a neural network algorithm from the measured brightness temperature data of Figure 1 and flight level air temperature. The neural network was trained with a combined multi-year radosonde data-set from Albany, New York and Barrow, Alaska. The sounding data was processed to a data set of brightness temperatures at the four radiometer frequencies, air temperature at the instrument and corresponding PWV and LWP. This simulated data set was used to train and test the neural network.

Ground GVR

183_in_Barrow

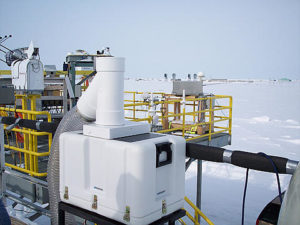
Figure 1. This prototype ground-based GVR has been continuously operating since April 2005 at the Barrow Alaska DOE ARM site.

Ground_GVR_Tb_data

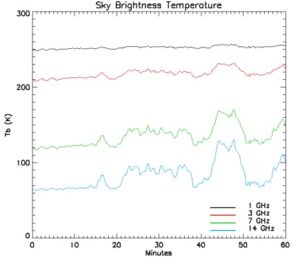
Figure 2. Brightness temperature data collected with the ground-based GVR in March 2005 at Amherst, MA from clouds containing super cooled liquid water.

Ground_GVR_data

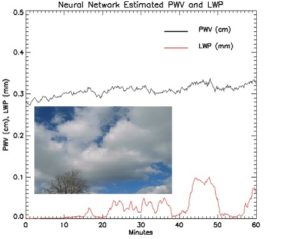
Figure 3. Precipitable Water Vapor (PWV) and Liquid Water Path (LWP) estimated using a neural network algorithm from the measured brightness temperatures of Figure 2 and surface temperature data.

GVR Publications

Pazmany, A. L. 2007: “A compact 183-GHz radiometer for water vapor and liquid water sensing.” IEEE Trans. Geosci.. Remote Sens. Vol. 45, No. 7, pp. 2202-2206, July 2007.  https://doi.org/10.1109/TGRS.2006.888104


Cadeddu, M. P., J. C. Liljegren and A. L. Pazmany 2007: “Measurements and retrievals from a new 183-GHz water-vapor radiometer in the Arctic.” Trans. Geosci. and Remote Sensing, 45, 7, 2207-2215.  https://doi.org/10.1109/MICRAD.2006.1677098


Pazmany A. L. and M. Wolde 2008: “A Compact Airborne G-band (183 GHz) Water Vapor Radiometer and Retrievals of Liquid Cloud Parameters from Coincident Radiometer and Millimeter Wave Radar Measurements.” Extended Abstract, Microrad 2008, Florence, Italy.


Zuidema, P., D. Leon, A. L. Pazmany, and M. P. Cadeddu, 2012: “Aircraft millimeter-wave passive sensing of cloud liquid water and water vapor during VOCALS-REx”, Atmos. Chem. Phys. Discuss., 12, 355-369.  https://doi.org/10.5194/acp-12-355-2012


Wang Z., J. French, G. Vali, P. Wechsler, S. Haimov, A. Rodi, M. Deng, D. Leon, J. Snider, L. Peng and A. L. Pazmany, 2012: “Single Aircraft Integration of Remote Sensing and In Situ Sampling for the Study of Cloud Microphysics and Dynamics.” Bull. Amer. Meteor. Soc., 93, 653–668.  http://dx.doi.org/10.1175/BAMS-D-11-00044.1